

Digital Farm Map
See the health of your land from anywhere

A digital map of your land that shows crop health, moisture levels and changes in land use through satellite imagery.
What the map shows

NDVI (Vegetation Health)
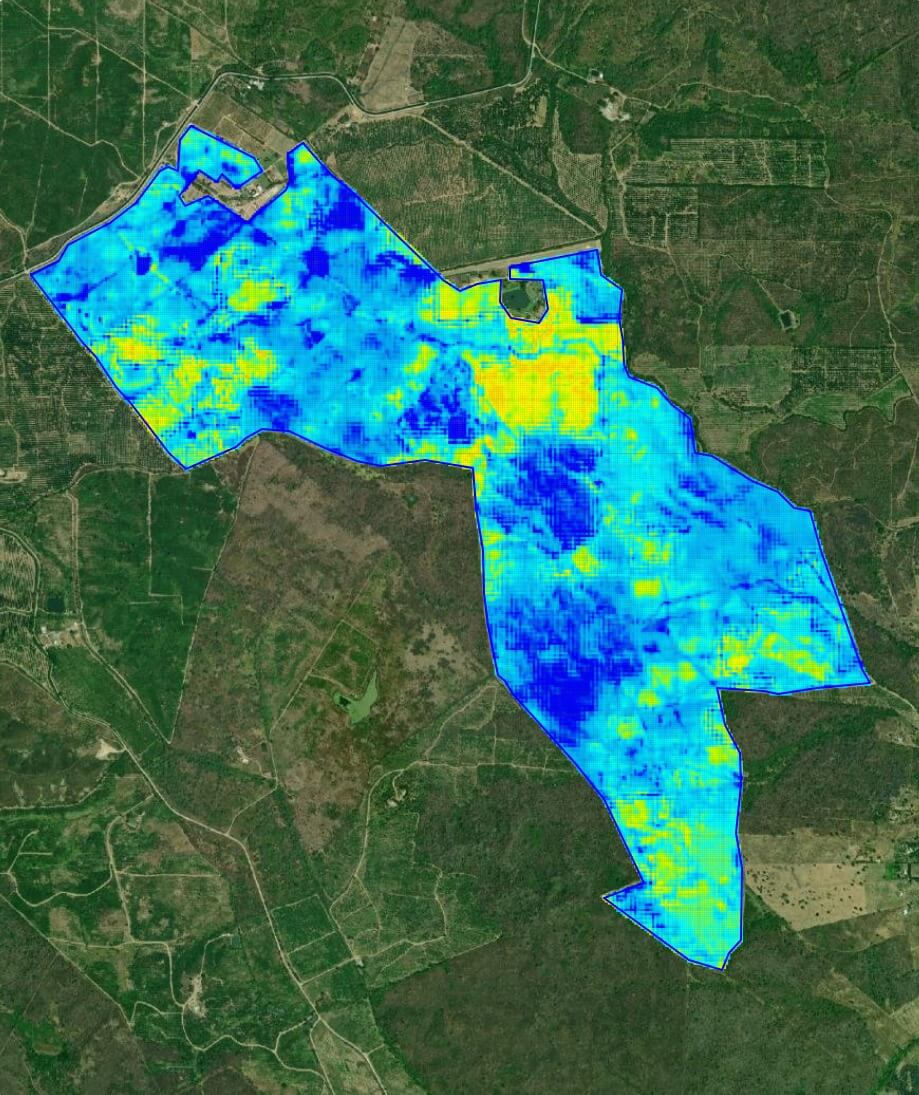
NDVI (General Crop Health)
Shows overall plant vigor so you can quickly tell which areas are strong and which ones are struggling.
Red Edge (Early Stress Detection)
Helps you notice stress before the crop changes color or loses strength. This allows faster action and prevents loss.
Leaf Water Stress
Shows the level of water stress experienced by the leaves. This helps you identify areas affected by water deficit or excess, detect stress before it’s visible, and understand how irrigation and soil variability are impacting the crop.
This insight tells you not only how your crop is coping today, but also where intervention is needed to protect yield and productivity.
Moisture Map
The moisture map helps you understand how water is distributed across your land. It shows which areas are receiving enough water and which areas are drying out or oversaturated.
This allows you to adjust irrigation before damage occurs. When a zone shows low moisture, you can act early instead of waiting to see visual stress in the plants. When a zone shows excessive moisture, you can correct drainage or avoid disease risk.
By comparing moisture with the vegetation map, you can quickly understand why a part of the crop is underperforming — whether it is a water issue or something else. This saves time in diagnosing problems and helps prevent yield loss.

Deforestation Map
The deforestation map shows how your land has changed over the last five years. It confirms whether the natural cover has been maintained or cleared, which is important for sustainability and responsible land use.
Farmers normally need outside consultants or government records to prove this history, which takes time and paperwork. With this map, the farm’s land-use history is visible immediately, without extra reporting or verification steps.
This gives you a simple way to show buyers, cooperatives or certifying bodies that your operation respects the environment and protects native areas, which increases trust and supports your farm’s reputation over time.
How it works?

Map Your Land
Draw or select the area of your farm you want to monitor. If needed, we help you outline it correctly.

Get Your Analysis
The platform creates your digital map and runs the vegetation, moisture and deforestation analysis for that area.

Weekly Insights
Your map is updated every week with new satellite data so you always see the most recent condition of your land.

Track Progress
Compare past and present results to understand how your land is evolving and where attention is needed.
Why it matters
Farmers today usually have to hire a drone company or a field technician to get this kind of land analysis. This costs money every time they come to the farm and the information is only from that single visit. If the crop changes two weeks later, you have to pay again.
With Farm Map Pro you do not need to bring anyone to the field.
You get new satellite readings every week without scheduling, without travel, and without paying per visit. This means you can detect changes as they happen instead of waiting until there is visible damage.
This also gives you a record of how your land has been managed over time. Instead of a one day snapshot, you have continuous evidence of how you care for your land across the season.
